Know how the year ends.
Performance Intelligence is knowing the probability that a plan will hit its target, what is moving that number, and which action moves it back. Every target has odds, every move has a driver, every claim has evidence.
Horizon in action
Inside Horizon: the plan, its odds, the levers, and the proof that the intervention moved the number.
The planning workspace
Watch the lever move: P 48% recounts to 71%, the fan lifts toward target, and the negotiation signs off.
See it on your data →Odds, not status
Reviews tell you where you are. They dont tell you where youll finish. A status field stays green for ten months and turns red six weeks before the close, too late to change the year. The model saw the same year differently: odds fell from 74% to 61% in March, with the cause named as discount overrides in DACH, at twice policy.
- NOV, the status turns red. Ten months of green, then red six weeks before the close.
- MAR, the model flags it. Odds fall from 74% to 61%, cause named.
- JUN, the action is funded. Re-pricing tested before any money moves: P 48% to 71%.
- DEC, delivered. P 85%. The close confirms what the model had been saying since March.
Nine months is the difference between managing the year and explaining it.
Plan by simulation
Most tools split the target equally, then discover in December who could never carry it. Horizon sets the target on thousands of simulated futures, not one guess, so the delivery risk is visible before anyone commits to the number, and distributes it according to the probability of success.
- Target P 74%. In 74 of 100 simulated year-ends, this plan finishes on or above target.
- Team A P 82% carries more. Team B P 61% carries its share.
- Team C P 44% gets support, not a fantasy.
- Uncertainty is carried from each driver rather than added at the top.
The best plan is the one most likely to succeed.
Follow the number down
A gap that cannot be traced becomes a room full of opinions. Every probability has a reason here: group to region to unit to objective to root cause, four clicks, and every step is a fact. Each level carries its contribution to the gap, so the room argues about size, not existence.
- Sized at every level, so the trail is evidence rather than assertion.
- It ends at a lever, never at ask around in the review.
- Every input traces back to the system it came from.
This plan is at risk because discounting in DACH is out of policy. A fact, not a hunch.
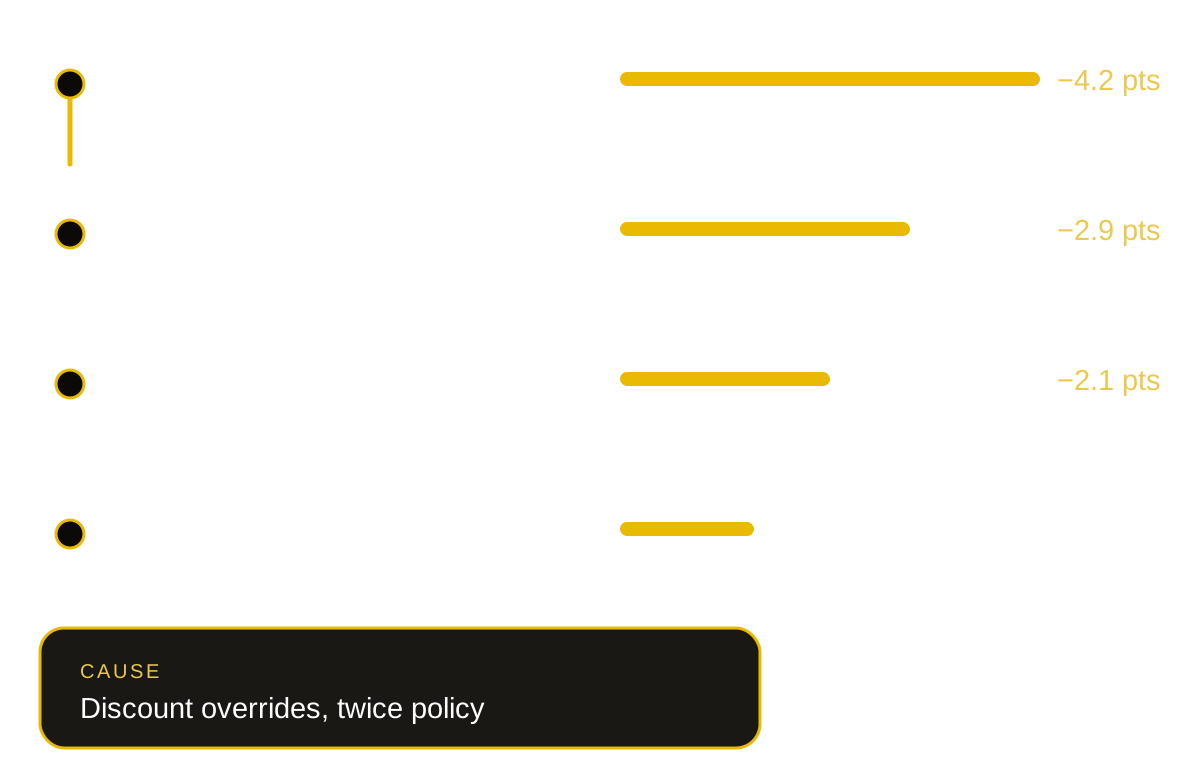
Group target P 48%, -4.2pts vs plan. EMEA -2.9pts, DACH unit -2.1pts, price realisation the failing objective, discount overrides at 2x policy.
Test the move before you fund it
Knowing the cause is only useful if you can test the response. Before you change the plan, see what happens if you do. Accounts, growth per account, headcount: whatever moves your number. One pull ripples through every derived metric and objective it touches, and the plan moves from P 48% to P 71%.
- Derived metrics included. EBITDA moves when revenue or cost moves, the maths is the graph, not a hope.
- Objectives update. Every affected objective recomputes its odds the moment you move a lever.
- Committed with governance. The plan of record changes once, approved, and everyone sees the same new number.
Test the move before you commit the quarter.
Negotiate inside the plan
The negotiation happens inside the plan, not in email: the counter-offer, its cost, and the agreement, on the record. Team B counters -24% to -21%. Cost disclosed, resets 3 sign-offs. Accepted, recorded forever. No forked spreadsheets, and the original ask survives every negotiation.
- What was agreed, on record. The value, the confidence, the person, the moment, for every approval.
- One number, per viewer. The number is computed once for each viewers scope.
- A close you can sign. Attestation with evidence, blocking items block, history append-only.
- Private plans stay private. They simply stop being a different version of the truth.
Structure for the organisation, flexibility for the individual: one version of the truth.
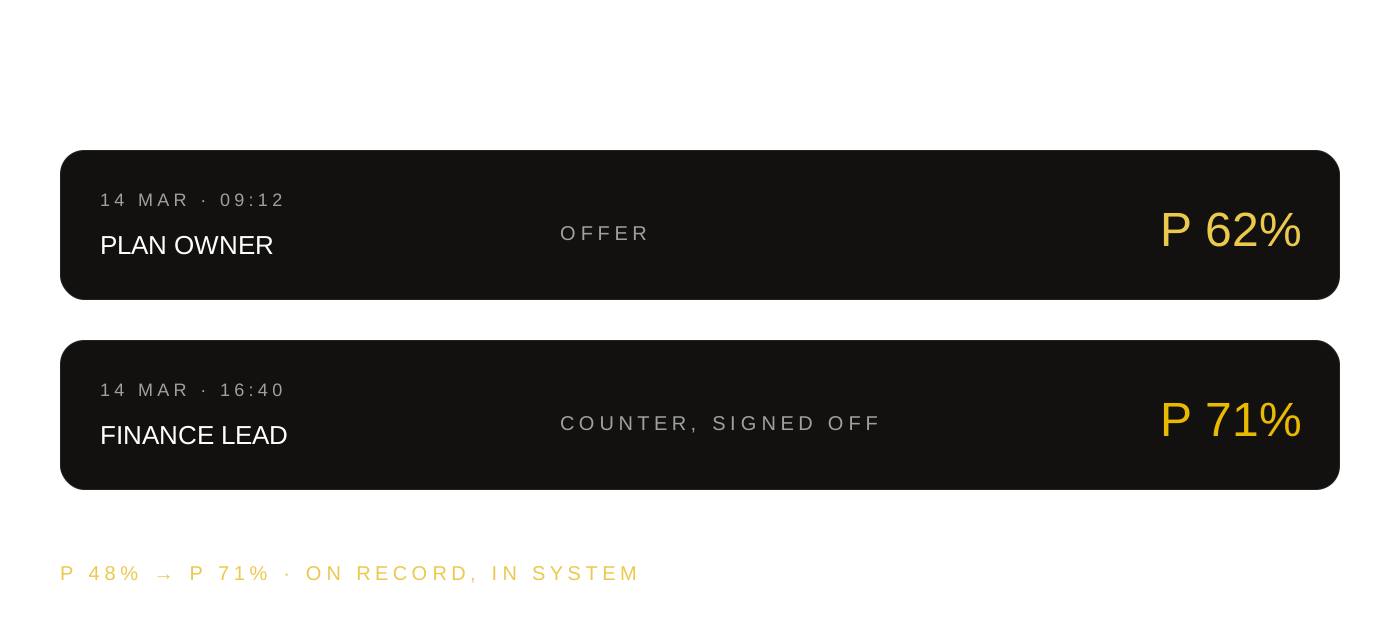
Group distributes -24% to Team B, set on simulation at P 61%. Team B counters -24% to -21%, cost disclosed, resets 3 sign-offs. Accepted, recorded forever. On the record. History append-only.
Runs with the other engines
Horizon and Pulse run on the same event backbone, scoped to each viewers permissions at every step. The exception that interrupts someone this morning is the same event that moves the years probability.


Questions executives ask
See your plan with its odds attached
Performance Intelligence turns targets into outcomes. Plan, track, deliver, on your own numbers.